26 Mar TikTok vs. Instagram: Comparing Average Engagement Rates in 2026
Summary
In today’s fiercely competitive social media landscape, understanding platform performance metrics is crucial for marketers developing effective strategies. This comprehensive analysis examines the current state of TikTok and Instagram engagement rates in 2026, offering valuable insights for brands looking to maximize their social media ROI.
What is Engagement Rate?
Engagement rate measures audience interaction with your content relative to your follower count or reach. It typically includes:
- Likes
- Comments
- Shares
- Saves
For both TikTok and Instagram, the engagement rate is a vital indicator of content performance and audience connection.
Key Findings: TikTok vs Instagram Engagement in 2026
Engagement Rates by Follower Range
TikTok vs Instagram Engagement Rates by Follower Range in 2026 by The Influencer Marketing Factory
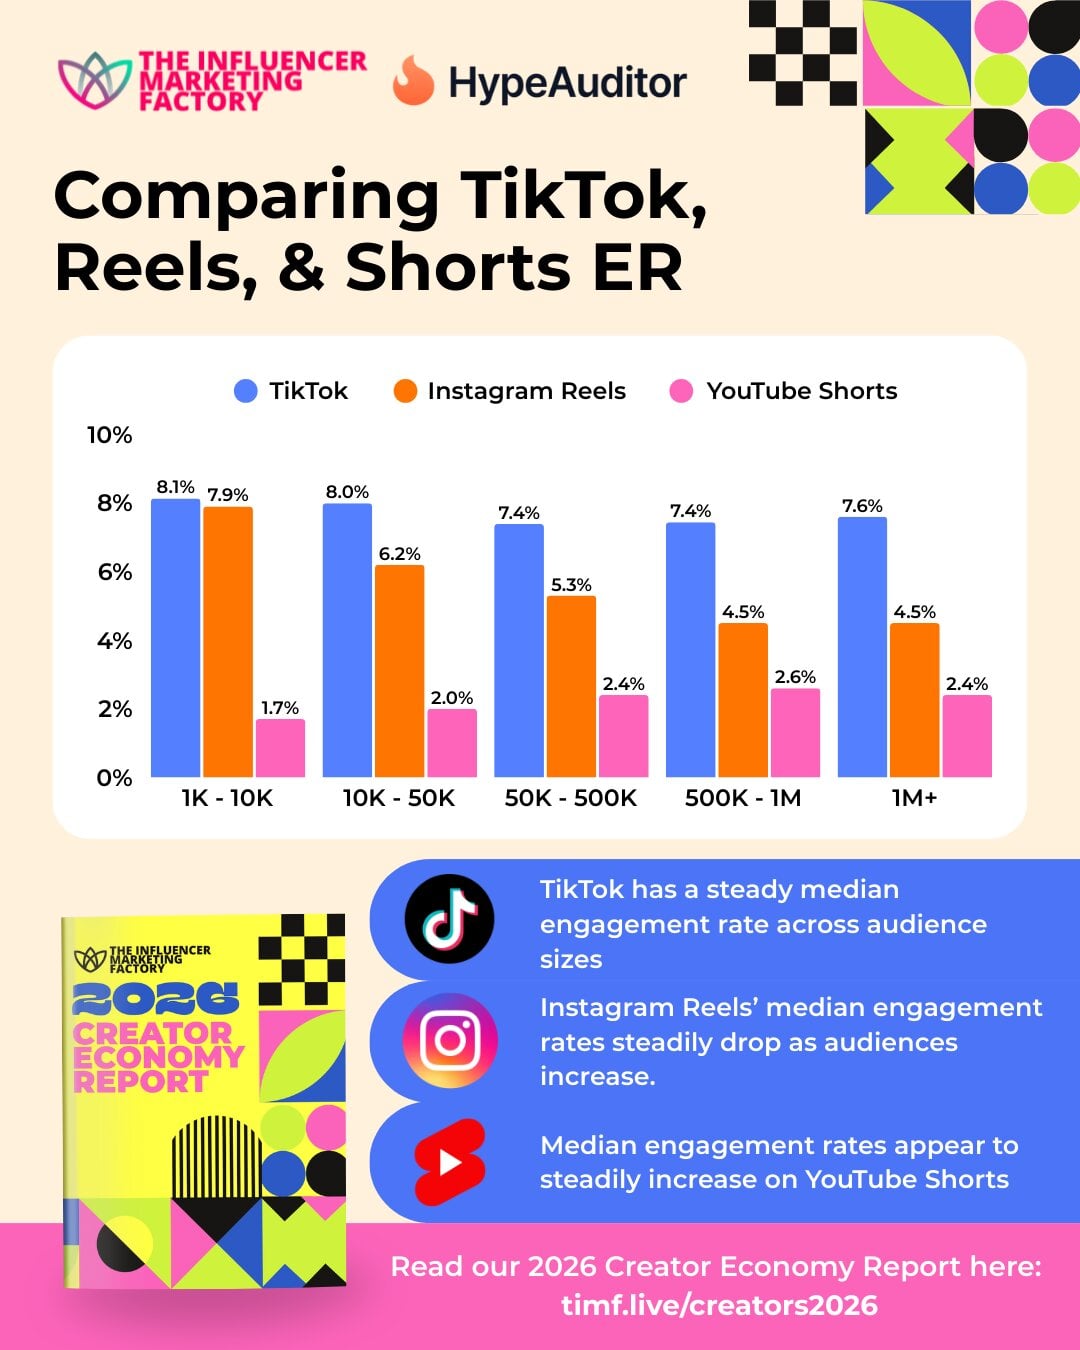
| Follower Range | TikTok Median ER | Instagram Reels Median ER |
| 1K-10K | 8.1% | 7.9% |
| 10K-50K | 8% | 6.2% |
| 50K-500K | 7.4% | 5.3% |
| 500K-1M | 7.4% | 4.5% |
| 1M+ | 7.6% | 4.5% |
TikTok Engagement Rates in 2026
Current Average Engagement Rate
According to the latest survey data from The Influencer Marketing Factory, TikTok shows impressive engagement rates ranging from 7.4% to 8.1%, depending on follower count. With our 2026 Creator Economy Report revealing an average median engagement rate of 8%, TikTok remains the most engaging major social media platform in 2026.
Factors Affecting TikTok Engagement
Factors, including account size, content niche, and format, all generally impact engagement rates, but our 2026 Creator Economy Report uncovered an interesting engagement trendline from nano to mega-influencers.
- Account Size: The Influencer Marketing Factory’s data clearly shows a correlation between follower count and engagement. TikTok engagement rates slightly decline as follower counts approach 100K, then gradually increase, revealing a new reverse bell curve in performance:
- Accounts 1K-10K: 8.1% (Highest engagement rate)
- Accounts 10K-50K: 8%
- Accounts 50K-500K: 7.4% (Lowest engagement rate, inflection point)
- Accounts 500K-1M: 7.4%
- Accounts with 1M+: 7.6%
- Industry/Niche: Art, Design & Creative is the top-performing niche across TikTok accounts with a 9.3% median engagement rate. This performance comes as not much of a surprise, considering TikTok’s deep roots in creativity and innovation.
- Content Type: TikTok’s current 2026 algorithm favors community engagement, pushing new content to established followers in comparison to its past discovery-driven recommendation system. Thus, videos that align with creators’ followers’ interests may showcase higher engagement in comparison to overly trendy content.
Why TikTok Leads in Engagement
In comparison to both Instagram and YouTube, TikTok greatly outperforms in median engagement and maintains a steady rate across audience sizes. TikTok’s video-first algorithm continues to prioritize highly engaging content, rewarding posts that drive conversations and shares. The platform’s comment-based trends, creator responses, and interactive culture foster genuine conversations, making it the most conversational social platform in 2026.
Kickstart your influencer journey now
Partner with The Influencer Marketing Factory to leverage our extensive network of premium influencers. Streamline your campaign management from inception to conclusion, and attract your desired audience with compelling and engaging content.
Instagram Engagement Rates in 2026
Current Average Engagement Rate
The current average median engagement rate across Instagram Reels is 7.5%, according to new data from our 2026 Creator Economy Report. Notably, Instagram Reels engagement rates initially almost match those of TikTok, with a widening performance gap as followers increase and Reels engagement decreases.
Factors Affecting Instagram Engagement
Instagram’s algorithm is prioritizing reach over deep engagement. While more people are seeing content, fewer are interacting with it. This shift has transformed Instagram from an engagement-The most significant factor influencing Instagram engagement rates in 2026 is follower count, as outlined in our 2026 Creator Economy Report.
- Account Size: The Influencer Marketing Factory’s data clearly shows a negative correlation between follower count and engagement across Instagram Reels:
- Accounts 1K-10K: 7.9% (Highest engagement rate)
- Accounts 10K-50K: 6.2%
- Accounts 50K-500K: 5.3%
- Accounts 500K-1M: 4.5%
- Accounts with 1M+: 4.5% (Lowest engagement rate)
- Industry/Niche: Music & Dance (2.8%) is the top category in terms of median engagement rate across Instagram Reels.
- Content Type: Instagram Reels average median rate (7.5%) is nearly triple that of Instagram static posts (2.4%), further supporting our report’s findings that short-form video is the highest-engaging content format across socials.
Understanding Instagram’s 2026 Algorithm
Instagram Head Adam Mosseri shared to his personal account that Saves, Shares, and Watch Time are now the core factors that influence content ranking and recommendations within the platform’s algorithm. Reels creators looking to improve their engagement rates and appear more appealing to brands must keep these factors in mind when ideating content and shareable series. Humorous and informative content taps into each of these three algorithmic filters, which could be a useful strategy for creators in 2026.
How to Calculate Engagement Rate
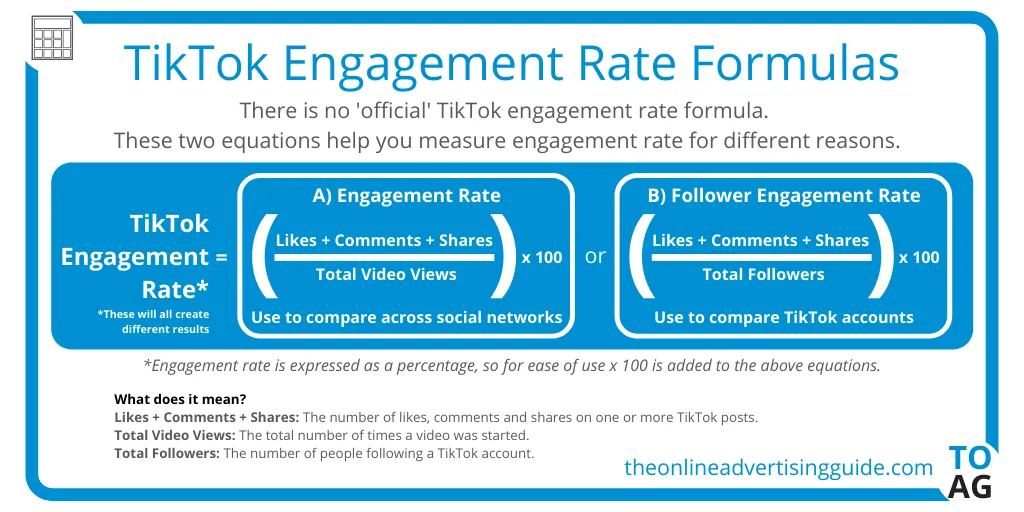
TikTok Engagement Rate Formula
Engagement Rate = (Total Engagement / Followers) × 100Where Total Engagement includes likes, comments, shares, and saves.
For example, if you have 3,000 followers and your video receives:
- 300 likes
- 45 comments
- 20 shares
- 15 saves
Your engagement rate would be:
((300+45+20+15) ÷ 3,000) × 100 = 12.67%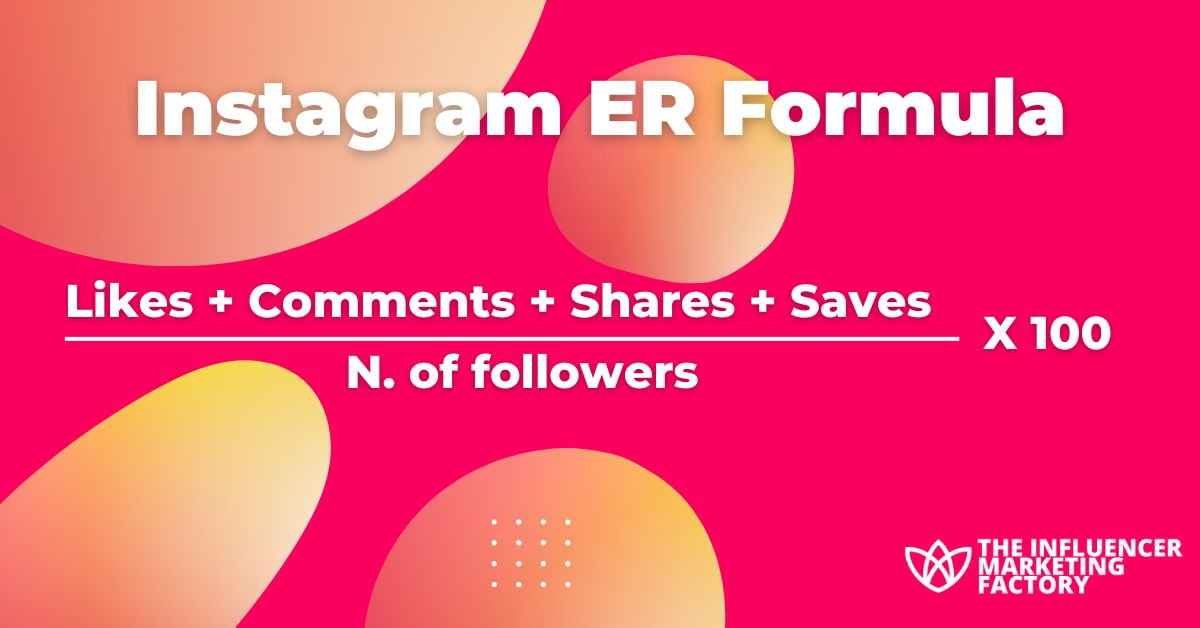
Instagram Engagement Rate Formula
Engagement Rate = (Likes + Comments + Saves + Shares) ÷ Followers × 100Some marketers also use reach instead of followers for a more accurate representation:
Engagement Rate = (Total Engagement ÷ Reach) × 100Platform Comparison: TikTok vs Instagram in 2026
Engagement by Follower Range
The data from The Influencer Marketing Factory reveals several important patterns:
- Consistent Gap: Across all follower ranges, TikTok consistently outperforms Instagram, staying between 7.4% to 8.1%. Instagram Reels, on the other hand, doesn’t surpass a 7.9% median engagement rate.
- Highest Engagement Tier: 1K-10K is the top-performing account tier across both TikTok (8.1%) and Instagram Reels (7.9%).
- Megainfluencer Performance: Megainfluencers on TikTok with 1M+ followers have a median engagement rate of 7.6%, almost double that of Instagram’s megainfluencers, who report a median engagement rate of 4.5%.
- Mid-tier Anomaly: While Instagram Reels’ engagement gradually decreases, TikTok demonstrates a reverse bell shape where engagement decreases across audience sizes until it hits an inflection point at 100K followers and begins to increase again.
- Proportional Difference: The performance gap between platforms remains relatively proportional across follower ranges, with TikTok consistently maintaining approximately twice the engagement rate of Instagram.
Engagement Leaders by Industry
An influencer showing a product in front of a light ring
Each platform shows different strengths across industries:
TikTok Top-Performing Industries:
- Art, Design & Creative (9.3%)
- Beauty & Personal Care (9.1%)
- Music & Dance (9%)
Instagram Top-Performing Industries:
- Music & Dance (2.8%)
- Fitness, Sports & Physical Activity (2.8%)
- Pets & Animals (2.6%)
TikTok:
- Short-form video remains supreme
- Educational and tutorial content performs exceptionally well
- User participation trends drive engagement
Instagram:
- Reels continue to gain traction
- Carousel posts maintain strong engagement
- Interactive Stories with polls, questions, and sliders
User Behavior Differences
TikTok users spend significantly more time on the platform, with US users watching 4.8 billion minutes of TikTok videos daily, compared to Instagram’s 4.127 billion minutes. The average US TikTok user spends over 24 hours monthly on the app—more than an entire day—which represents a substantial increase from 19.6 hours in 2021.
Strategic Recommendations for Marketers in 2026
When to Prioritize TikTok
- When engagement is your primary goal: The numbers make it clear: TikTok is the best platform for organic engagement, while Instagram is becoming more of a reach-focused platform.
- For younger demographic targeting: TikTok continues to dominate with younger audiences.
- When building community through conversation: TikTok’s comment-driven engagement creates stronger community bonds.
- For viral potential: The algorithm still offers greater potential for exponential reach.
When to Prioritize Instagram
- When reach matters more than deep engagement: Instagram’s algorithm prioritizes distribution.
- For visual product showcasing: Instagram’s polished aesthetic suits certain brands better.
- For cross-platform integration: Especially important for brands heavily invested in the Meta ecosystem.
- When targeting diverse age demographics: Instagram maintains strong popularity among Gen X and Millennials, who are almost twice as likely as Boomers to engage with influencers on the platform.
Integrated Strategy Recommendations
If engagement is your goal, Instagram alone won’t be enough: you need to integrate TikTok into your strategy. The most effective social media strategies in 2026 leverage both platforms complementarily:
- Content Cross-Utilization: Adapt content across platforms with platform-specific optimizations
- Audience Segmentation: Tailor messaging to each platform’s demographic strengths
- Platform-Specific Goals: Use TikTok for engagement and community building; Instagram for reach and visual brand development
- Consistent Tracking: Regularly measure performance against platform benchmarks to refine strategy
Conclusion
The engagement landscape in 2026 shows a clear distinction between TikTok and Instagram. While TikTok maintains its position as the engagement powerhouse with rates between 7.4-8.1% (depending on follower count), Instagram follows with engagement rates between 4.5-7.9%. Even at its highest engagement levels with smaller accounts, Instagram still cannot match TikTok’s performance.
Successful brands recognize these differences and develop platform-specific strategies that leverage each network’s unique strengths. As TikTok continues to be the engagement powerhouse and Instagram remains a staple platform, marketers must adapt their content approaches to maximize performance across both platforms.
By understanding these engagement benchmarks and platform dynamics, brands can make informed decisions about resource allocation and content development, ultimately achieving greater social media marketing success in 2026.
Kickstart your influencer journey now
Partner with The Influencer Marketing Factory to leverage our extensive network of premium influencers. Streamline your campaign management from inception to conclusion, and attract your desired audience with compelling and engaging content.
TikTok vs Instagram ER FAQs
- What is the average engagement rate on TikTok in 2026?
TikTok’s average median engagement rate is 8% in 2026, with rates ranging from 7.4% to 8.1% depending on follower count. It remains the most engaging major social media platform, outperforming both Instagram and YouTube. - How does Instagram Reels engagement compare to TikTok?
Instagram Reels has an average median engagement rate of 7.5%, but the gap widens significantly as follower counts grow. For accounts with 1M+ followers, TikTok’s engagement rate (7.6%) is nearly double Instagram’s (4.5%). - Which follower range gets the highest engagement on both platforms?
Nano-influencers with 1K–10K followers see the highest engagement on both platforms — 8.1% on TikTok and 7.9% on Instagram Reels. This is the only tier where Instagram nearly matches TikTok’s performance. - How do you calculate engagement rate on TikTok and Instagram?
For both platforms, the standard formula is: (Likes + Comments + Shares + Saves) ÷ Followers × 100. Some marketers substitute “Reach” for “Followers” in the denominator to get a more accurate picture of how content performs among those who actually see it. - What content niches perform best on each platform?
On TikTok, Art, Design & Creative leads with a 9.3% median engagement rate, followed by Beauty & Personal Care (9.1%) and Music & Dance (9%). On Instagram, Music & Dance and Fitness, Sports & Physical Activity tie at 2.8%, with Pets & Animals close behind at 2.6%. - Should brands use TikTok or Instagram in 2026?
The most effective strategy leverages both. TikTok is best when engagement and community building are the priority, especially for younger audiences. Instagram is stronger for reach, visual brand storytelling, and connecting with Gen X and Millennial demographics. An integrated approach — adapting content for each platform’s strengths — yields the best results.